02 From Where To Where
In the previous blog, we looked at only the destinations. However, we want to know where the trips come from as well, especially whether people come a long way to eat something, shop, or work. As a first step, the below chart shows that work-related trips are significantly longer on average than all the other categories.
Net flows
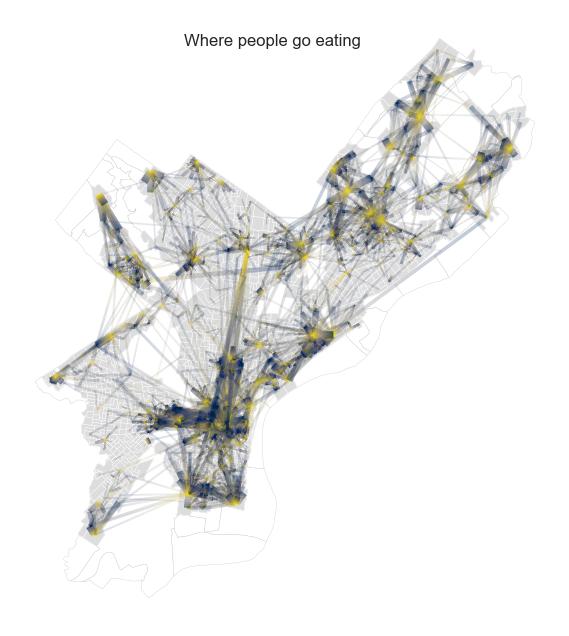
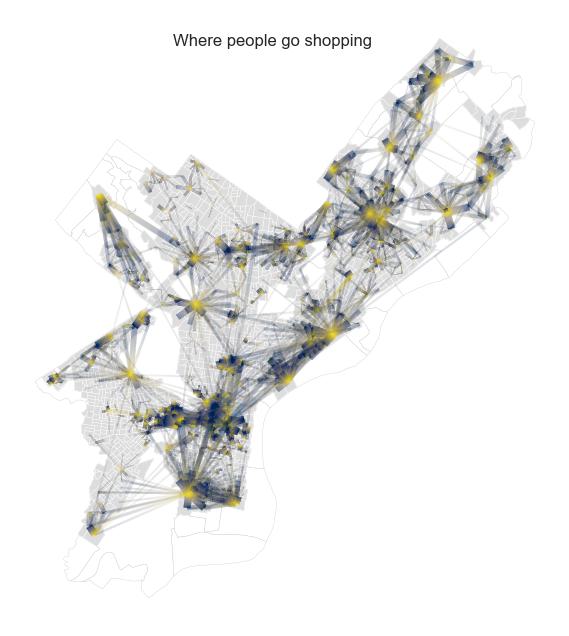
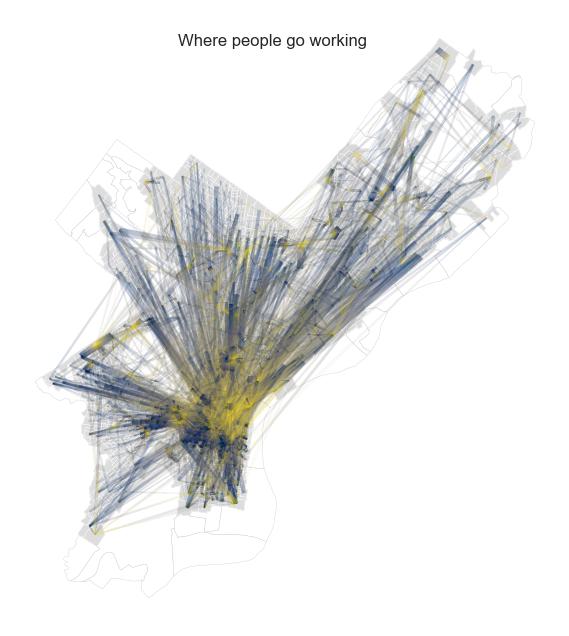
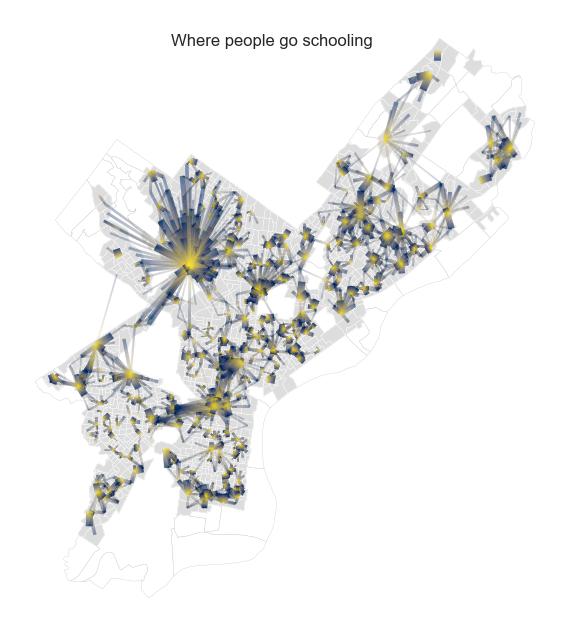
The below plots show the net-flows between pairs of block groups. Net flows mean the number of incoming trips minus the number of outgoing trips. The widths of the lines signify the volumn of the net flows, whereas the colors signify the direction, with blue meaning the origins and yellow representing the sinks. In this case, those “yellow areas” with long lines sticking to far-away locations are the major centers or attractors.
Note: to make the maps clearer, only net flows above a particular threshold (5 for eating, 10 for shopping and schooling, and 20 for working) are plotted.


Consistent with the previous blog, we can identify that work destinations are the most concentrated and work trips are the longest. On the other hand, shopping trips are much more diffused.
Code excerpt
Code excerpt: making the net-flow map of eating trips. For more detail, see this notebook.
def find_net_flow(df, purpose):
  """
  Takes in a purpose, returns the net flow between every two block groups
  Only keeps those with a net flow > 0
  """
  # Subset to only this purpose
  subset = df.loc[df.trip_purpose == purpose]
  subset = subset[['origin_GEOID', 'destination_GEOID']]

  # Aggregate by origin and destination
  agg = subset.groupby(['origin_GEOID', 'destination_GEOID']).size().reset_index().rename(columns = {0: 'count'})

  # || NO net flows originating and reaching the same block group
  agg = agg.loc[agg.origin_GEOID != agg.destination_GEOID,]

  # Now set a fixed direction for trip count || GEOID numerically smaller always as origin
  # If the other way around, revert the origin and destination, make count negative
  agg['count_single_dir'] = agg.apply(lambda x: x['count'] if int(x['origin_GEOID']) < int(x['destination_GEOID']) else -x['count'], axis = 1)
  agg['first_GEOID'] = agg.apply(lambda x: x['destination_GEOID'] if x['origin_GEOID'] > x['destination_GEOID'] else x['origin_GEOID'], axis = 1)
  agg['second_GEOID'] = agg.apply(lambda x: x['destination_GEOID'] if x['origin_GEOID'] < x['destination_GEOID'] else x['origin_GEOID'], axis = 1)

  # Again, group by same `first_GEOID` and `second_GEOID` so the positives and negatives cancel each other out
  agg_single_dir = agg.groupby(['first_GEOID', 'second_GEOID'])['count_single_dir'].sum().reset_index().rename(columns = {0: 'count_single_dir'})
  # Remove the zeros
  agg_single_dir = agg_single_dir.loc[agg_single_dir.count_single_dir != 0]

  # Now, make all counts positive
  # If negative, revert first and second GEOIDs
  agg_single_dir['count'] = agg_single_dir['count_single_dir'].abs()
  agg_single_dir['origin_GEOID'] = agg_single_dir.apply(lambda x: x['first_GEOID'] if x['count_single_dir'] > 0 else x['second_GEOID'], axis = 1)
  agg_single_dir['destination_GEOID'] = agg_single_dir.apply(lambda x: x['first_GEOID'] if x['count_single_dir'] < 0 else x['second_GEOID'], axis = 1)

  return agg_single_dir[['origin_GEOID', 'destination_GEOID', 'count']]
def make_net_flow_plot(net_flow_df, count_threshold, width_ratio, alpha_ratio, figure_title, fig_name):
  """
  `width_ratio` means the net trip count vs. width of lines on the map
  `alpha_ratio` likewise
  """
  # First do a threhold
  df = net_flow_df.loc[net_flow_df['count'] > count_threshold]

  # Then define count and alpha functions
  def get_line_width(count):
    if count > 5 * width_ratio:
      return 5
    else:
      return count / width_ratio

  def get_alpha(alpha):
    if alpha > alpha_ratio:
      return 1
    else:
      return alpha / alpha_ratio

  # Initiate a plot
  fig, ax = plt.subplots(figsize = (10, 8))

  for row in df.iterrows():
    x2 = row[1]['destination_x']
    x1 = row[1]['origin_x']
    y1 = row[1]['origin_y']
    y2 = row[1]['destination_y']
    count = row[1]['count']

    x = np.linspace(x1, x2, 500)
    y = np.linspace(y1, y2, 500)

    x_mid = 0.5 * (x[:-1] + x[1:])

    points = np.array([x, y]).T.reshape(-1, 1, 2)
    segments = np.concatenate([points[:-1], points[1:]], axis=1)

    # Make sure the correct color points to the correct direction
    if x1 < x2:
      cmap = 'cividis'
    else:
      cmap = mpl.cm.get_cmap('cividis_r')

    norm = plt.Normalize(min(x1, x2), max(x1, x2))
    lc = LineCollection(segments, cmap = cmap, norm = norm, alpha = get_alpha(count))
    lc.set_array(x_mid)
    lc.set_linewidth(get_line_width(count))
    ax.add_collection(lc)

  ax.set_aspect('equal', adjustable='box')

  # Plot the base
  phila_block_groups_2272.plot(
    ax = ax,
    color = 'white',
    edgecolor = '#bebebe',
    linewidth = 0.2
  )
  phila_block_groups_subset.plot(
    ax = ax,
    color = '#dddddd',
    edgecolor = 'white',
    linewidth = 0.3
  )

  ax.grid(False)
  ax.axis("off")
  fig.suptitle(figure_title, y = 0.85)
  fig.savefig(f'../../final-pages/assets/images/{fig_name}.jpg', bbox_inches='tight')
eat_net_flow = merge_od_points(find_net_flow(df, 'Eat'), block_groups_centroids)
make_net_flow_plot(eat_net_flow, 5, 5, 50, 'Where people go eating', 'eat')